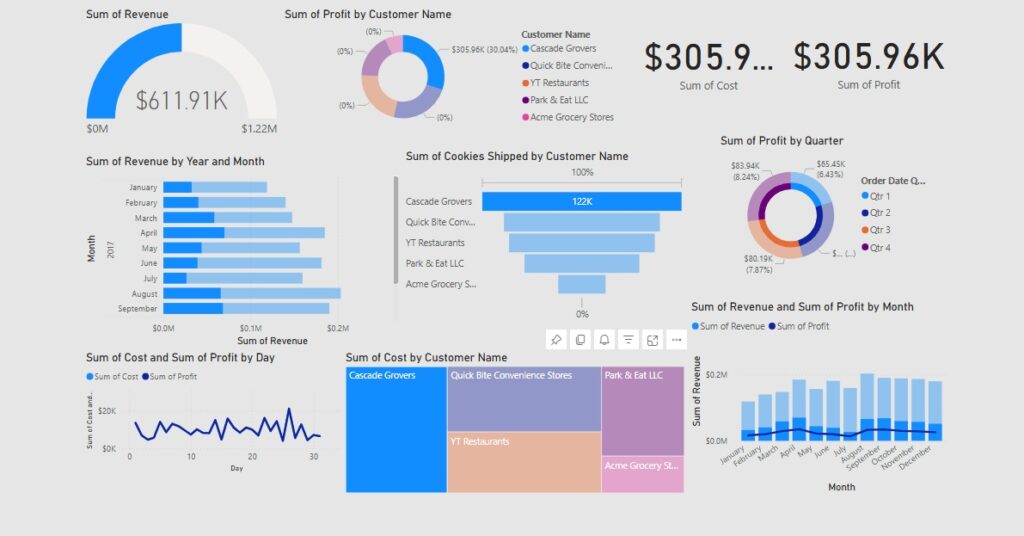
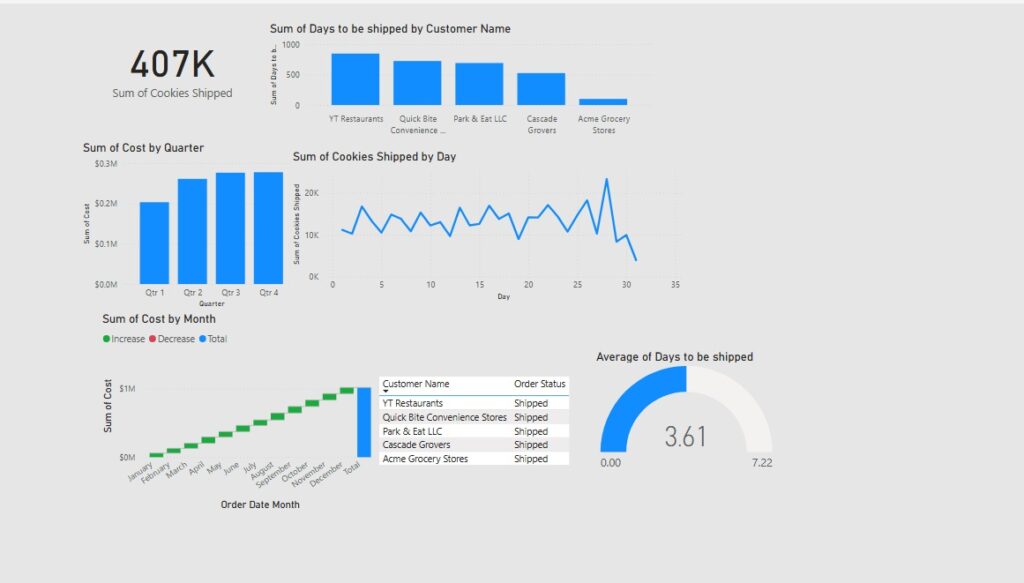
At Kevin Cookie Company, understanding our financial performance across markets is essential to driving growth and refining our product offerings. Our Financial Dashboard Project empowers us with clear, data-driven insights into sales performance, revenue trends, and profitability on a global scale. Here’s a look into what this dashboard achieves:
Project Scope and Objectives
The Financial Dashboard was designed to:
- Track Sales Performance across various regions, including Canada, Mexico, and Germany.
- Analyze Profit Margins by product type to identify high-performing items like Chocolate chips and determine areas for cost optimization.
- Visualize Monthly and Annual Trends in revenue, cost, and profit to uncover seasonal patterns and year-over-year growth.

Key Insights
- Revenue Growth and Profitability
The dashboard reveals revenue breakdowns by month and region, highlighting profitable and peak seasons. This insight helps us strategize product promotions and manage inventory effectively to match demand. - Regional Performance and Market Penetration
We identify growth opportunities and potential market expansion areas by comparing performance across different regions. For example, Canada and Germany showcase strong sales, allowing us to explore new product launches and targeted marketing campaigns in these regions. - Product-Level Financial Analysis
Each product’s cost and revenue structure is analyzed in-depth to determine profitability per cookie sold. Products like the Chocolate Chip cookie, with strong sales in multiple countries, serve as benchmarks for refining and optimizing other offerings.

How the Dashboard Helps
The Kevin Cookie Company Financial Dashboard is a strategic tool that transforms raw data into actionable insights, enabling informed decision-making across all business operations. By visualizing financial data in an accessible format, it supports:
- Real-time decision-making based on current performance metrics.
- Budget adjustments and cost control, directly impacting our bottom line.
- Identification of high-demand products and regions for maximizing profitability.
